Box, Hunter, and Hunter
I uploaded some datasets from Box, Hunter, and Hunter. It is hard to work through the examples in a stats book if you don't have ready access to the data. I looked around, and I found very little on the Interweb from BHH, even though it is a common book. All of the datasets are from the 1st edition, so if someone wanted to learn some stats, the book would be inexpensive.
I also started with R. R is a language and environment for statistical computing and graphics distributed under the GNU General Public License. R is admittedly a little intimidating even for me, because it all run through the command prompt. I decided to give it a go however, because R is powerful, and more imporantly, free. I use JMP® at work, and I learned JMP in school because NAU had a site license. JMP is really pretty good, it is powerful, easy to use, and well-written. It also costs money, so I don't have a copy at home.
JMP makes output like this:
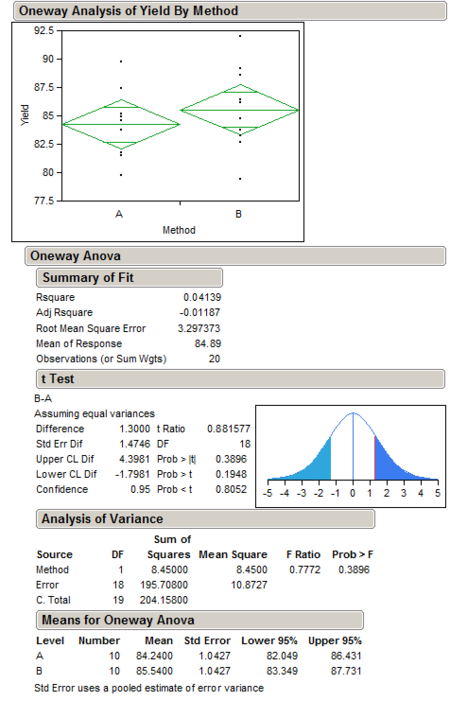
Pretty nice eh? This is the data from Table 2.1 of Box, Hunter, and Hunter.
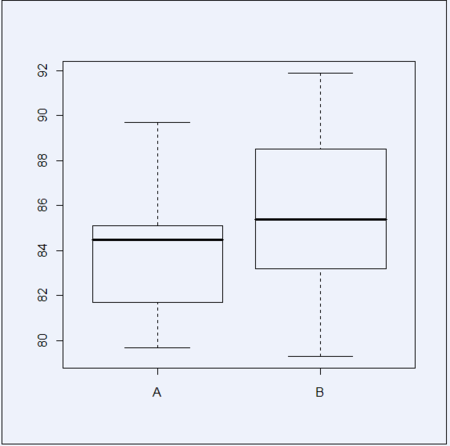
I fooled around with R today, and I made this:

Not precisely the same thing, but JMP has it's own way of doing things. I could replicate all of the output that JMP made in R with time. The boxplot is the standard way, so that is easy in R. Over time, I hope to build up a library of datasets from BHH. I hope to learn R along the way, but it is time-consuming at first to learn the commands. Once I get it down, I think I could almost anything with it and R includes many, many more routines than JMP, but they are harder to get to.

Comments ()